Steal This ChatGPT Listing Presentation Advantage
Quick Summary
- Most listing presentations look identical because agents bring the same comp sheets and the same generic market pages.
- The better move is to keep the human pricing judgment, then use AI to package the evidence into clear branded visuals.
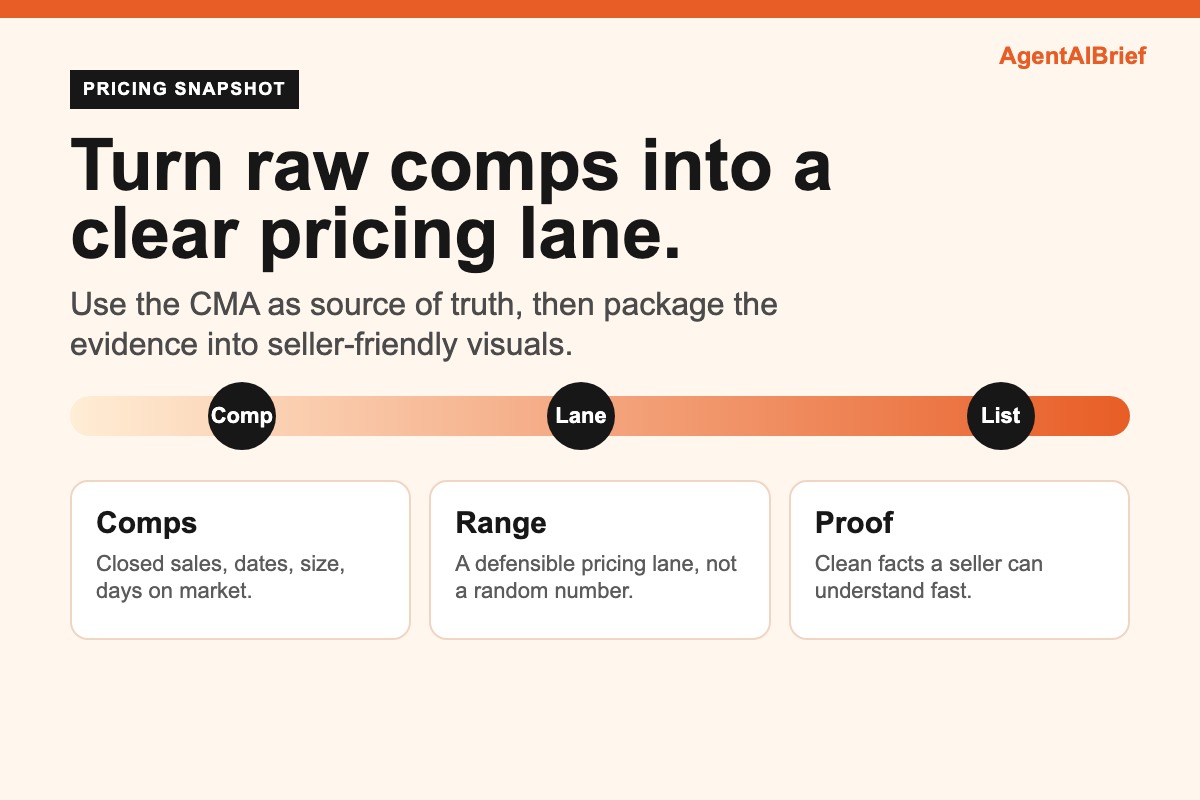
- This workflow uses your CloudCMA or MLS comps as the source of truth, then adds deep research context for buyer confidence.
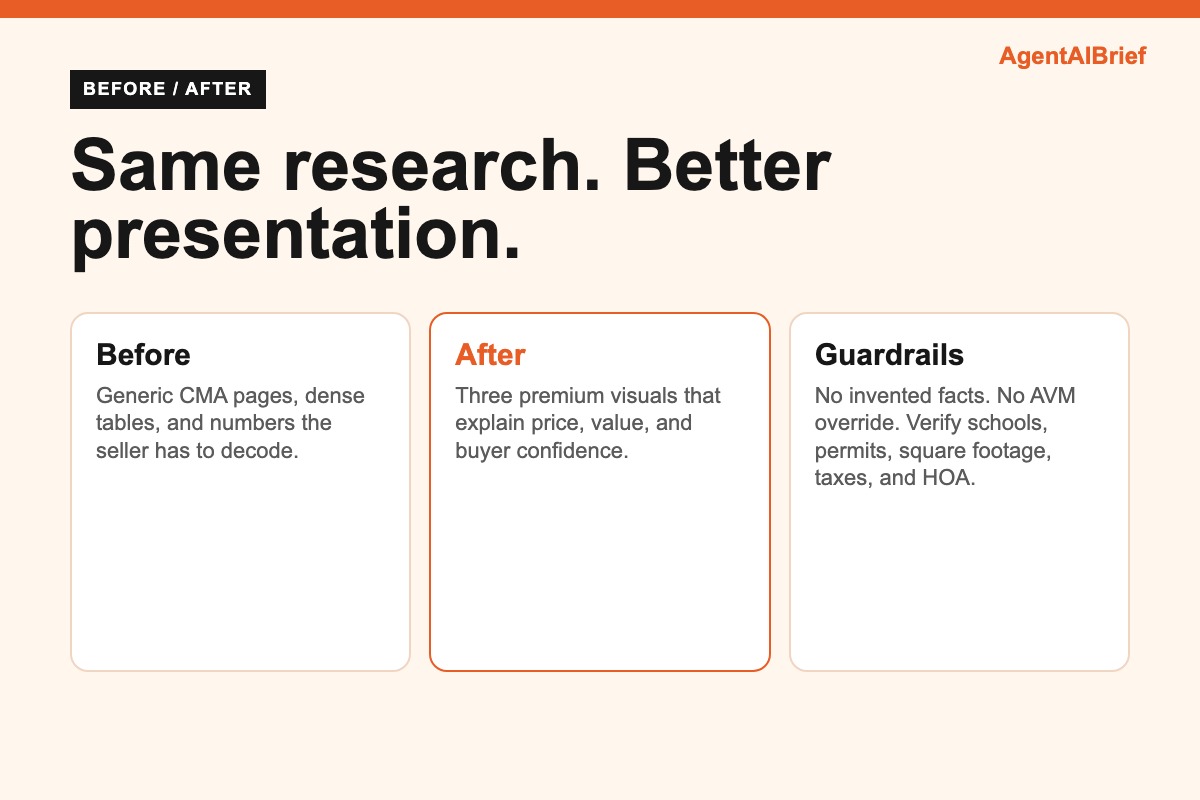
- The copyable prompt below tells ChatGPT exactly how to create three premium 8.5 x 11 presentation images.
- The goal is not fake certainty. The goal is a cleaner seller conversation backed by comps, public records, and clear caveats.
The listing appointment is usually won before the agent sits down. Sellers can feel the difference between an agent who brought a generic packet and an agent who already understands the property, the comps, the neighborhood context, and the likely buyer objections.
That is why this ChatGPT listing presentation workflow works.
It does not replace pricing judgment. That would be a mistake. You still pull your own comps, review the property, adjust for condition, and make the pricing call like a professional. AI is not the appraiser, the broker, or the local expert.
AI is the presentation layer.
It helps turn the work you already did into something a seller can understand in thirty seconds.
Why The Old Listing Packet Falls Flat
Most agents walk in with a CMA, a few printouts, a market report, and a confident explanation. That can work if the agent is strong in the room, but the materials often look like every other agent's materials.
The seller sees numbers, addresses, square footage, and sold dates. What they do not always see is the story.
Why is this the right range? Why is one comp stronger than another? What property facts support the upper end? What neighborhood features help demand? What should be verified before going live?
The agent may know those answers, but the packet rarely makes them obvious.
The Better Workflow
Start with the human work. Pull the comps manually. Read the MLS notes. Look at condition, photos, updates, lot, layout, finished square footage, concessions, days on market, and list-to-sale behavior.
Then run separate research reports on the property and area. You can use ChatGPT, Gemini, Claude, Perplexity, or another research tool, but the instruction is the same: gather public context, permits if available, property record details, area demand drivers, school assignment notes, commute access, and anything that affects buyer confidence.
Then give ChatGPT three things:
- The CMA or comp report.
- The deep research reports.
- Your logo, brand color, and any photos or maps you want included.
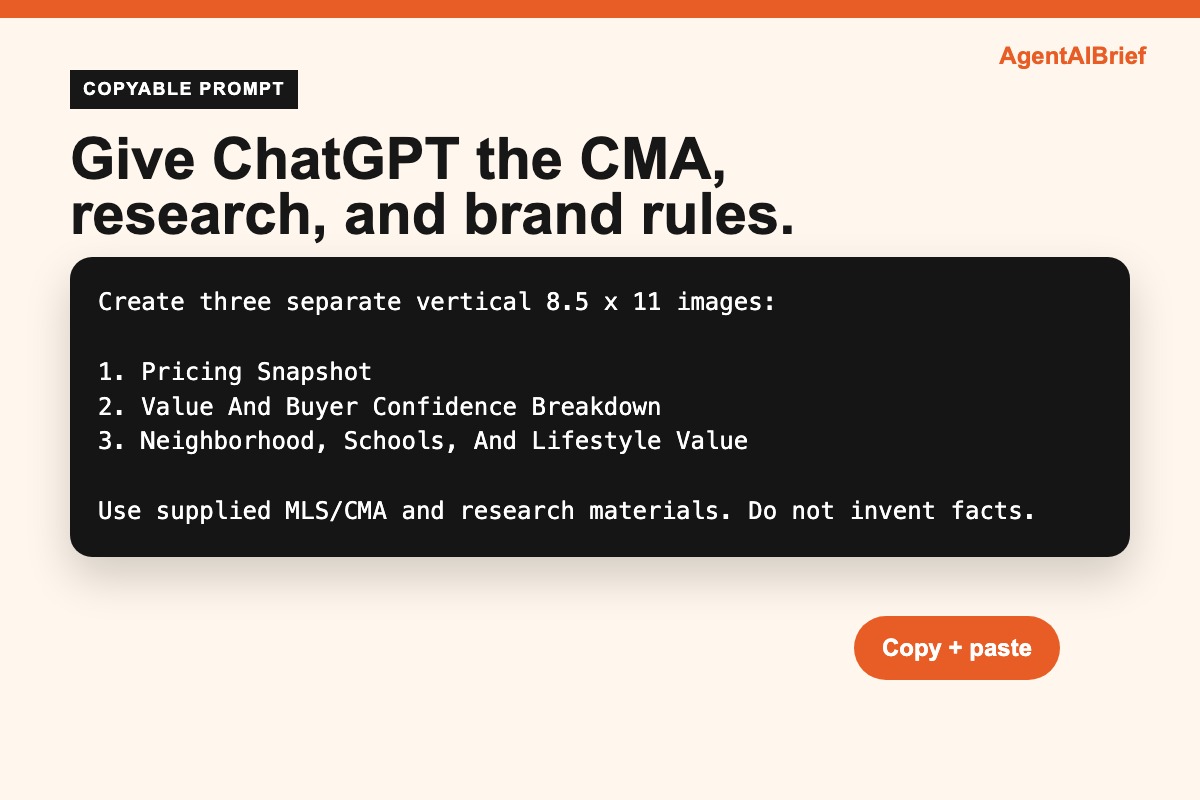
Now ask it to create three separate presentation visuals:
- Pricing Snapshot.
- Value And Buyer Confidence Breakdown.
- Neighborhood, Schools, And Lifestyle Value.
Those three pages are easier for a seller to understand than a wall of raw comps.
Copy And Paste This Prompt
Create three visually stunning, easy-to-understand vertical 8.5 x 11 inch pricing and fact guide images using the files supplied by the agent.


The supplied files may include:


1. A CloudCMA, MLS comp report, or pricing analysis

2. One or more deep research reports

3. Optional logo, brand color, or visual brand guidance

4. Optional listing photos, property photos, maps, floor plans, or community images


Primary objective:

Create a polished, premium real estate pricing guide that helps a homeowner or buyer quickly understand:


1. The most defensible pricing range

2. The comparable sales logic behind that range

3. The property-specific facts that support buyer confidence

4. The neighborhood, school, and lifestyle advantages that help the home compete


Branding instructions:

Use the supplied logo if one is provided.

If no logo is provided, use clean text branding based on the agent or company name supplied in the files.

If a brand hex color is provided, use it as the main accent color for headers, icons, charts, callout boxes, and key numbers.

If no hex color is provided, choose a tasteful premium real estate palette with one strong accent color, charcoal text, and a clean white or soft neutral background.


Source priority:

Treat the CloudCMA or MLS comp report as the primary source for comparable sales and pricing.

Use the deep research reports as supporting sources for permitted improvements, renovations or upgrades, square footage clarification, lot, age, tax, and property record context, neighborhood advantages, HOA or community amenities, school assignments and GreatSchools-style ratings, commute access, environmental risk profile, and local demand and market context.


Do not let AVMs override the MLS or CloudCMA comparable sales.

Do not invent facts.

Do not exaggerate.

If sources conflict, use the more conservative version or label the point as "verify before listing."

If permit data is unclear, say "permit status should be verified" rather than presenting it as finalized.

If square footage differs across sources, explain the difference clearly, especially above-grade versus total finished square footage.


Overall design style:

Make the guide feel high-end, clean, and credible.

Use large readable typography.

Use no more than three major font sizes per page.

Use strong hierarchy, clean spacing, rounded cards, subtle shadows, simple icons, and elegant charts.

Avoid cluttered tables, tiny footnotes, generic clipart, and overly busy backgrounds.

Each page should stand alone and be understandable in under 30 seconds.

Keep 0.25 inch safe margins.

Design for 8.5 x 11 vertical print output at 300 DPI if possible.


Create exactly three separate vertical 8.5 x 11 images:


IMAGE 1: Pricing Snapshot

Show the most defensible pricing range based primarily on the CloudCMA or MLS comps. Create a horizontal pricing range bar using the closed comparable sales from the CloudCMA or MLS report. Plot each major comp with address or short comp label, sold price, sold date, beds and baths, square footage, and days on market if available. Then show the recommended pricing lane for the subject property as a highlighted range. Include 3 to 5 stat cards from the CloudCMA or MLS report.


IMAGE 2: Value And Buyer Confidence Breakdown

Explain why the home supports the pricing range. Use property-specific facts, improvements, condition, lot, layout, systems, permitted or documented upgrades, square footage notes, and buyer confidence signals. Include a small "Buyer Confidence" box. If permit status is uncertain, label it clearly.


IMAGE 3: Neighborhood, Schools, And Lifestyle Value

Use the deep research report to highlight positive area facts that help explain demand. Create a clean neighborhood value map or icon-based layout around the home. Use only supported facts from the research report. Include an "Assigned School Snapshot" card only if school names, distances, and ratings are supplied. Include a small note that buyers should verify schools, permits, square footage, taxes, HOA, and county records.


Footer instructions for all three images:

Include small source-style footer text: "Based on supplied MLS/CMA and research materials. Information deemed reliable but not guaranteed."


Final output requirements:

Return three finished vertical image concepts. Each image should be clean, premium, and easy to understand. Do not cram in every fact. Prioritize the facts that most clearly support pricing, buyer confidence, and marketability. Use the supplied reports as source material, not as copy to paste verbatim.
How To Use The Three Images In A Real Appointment
Use the Pricing Snapshot first. This is the cleanest way to show your range, your comp logic, and your recommended lane. It should make the conversation calmer because the seller can see the evidence instead of just hearing your opinion.
Use the Value And Buyer Confidence page second. This is where you explain condition, updates, permits, square footage notes, systems, layout, and the facts that support buyer trust.
Use the Neighborhood And Lifestyle page third. This is not about targeting a type of buyer. It is about showing factual area context: commute routes, shopping, parks, community amenities, schools if verified, and other public information that helps explain demand.
The key is restraint. Do not cram every fact into every page. A seller presentation should feel premium, not desperate.
The Guardrails
Do not invent facts. Do not let AI override your comps. Do not use AVMs as the source of truth when you have real closed sales. Do not present permit data as final if it is unclear. Do not claim school facts without verification. Do not hide uncertainty.
The prompt intentionally includes caveats because the best listing presentation is confident and careful at the same time.
That is the move agents miss.
AI can make you look more polished, but only if your source material is solid. Bad comps plus pretty graphics is still bad advice. Good comps plus clear packaging is where the advantage appears.
What To Check Before Showing It To A Seller
Before the appointment, read every number on the visuals like a broker would. Confirm the comp addresses, sale prices, settlement dates, concessions, square footage, and days on market. Confirm any school names directly with the appropriate source. Confirm any permit note before you talk about improvements. If the AI made a chart that looks beautiful but quietly changed a number, delete the chart and regenerate it.
That review step is not optional. It is the difference between looking prepared and looking careless.
Why This Helps Earn Listings
Sellers are comparing agents quickly. They may not know how to evaluate every comp adjustment, but they know when an agent looks prepared. A clean visual guide signals that you did more than run an automatic report.
It also changes the conversation. Instead of arguing over one Zestimate or one neighbor's sale, you can walk through a structured pricing lane, buyer confidence factors, and verified location context.
That makes your recommendation easier to trust.
The Bottom Line
The agent who earns the listing is usually the agent who makes the decision feel clearest.
Use your own pricing judgment. Use real comps. Use verified research. Then use ChatGPT to turn that work into three premium visuals a seller can understand quickly.
That is the hack. Not replacing expertise. Packaging it better.